- April 17, 2026
- Posted by: EWGFX
- Category: Technical analysis
STRUCTURE
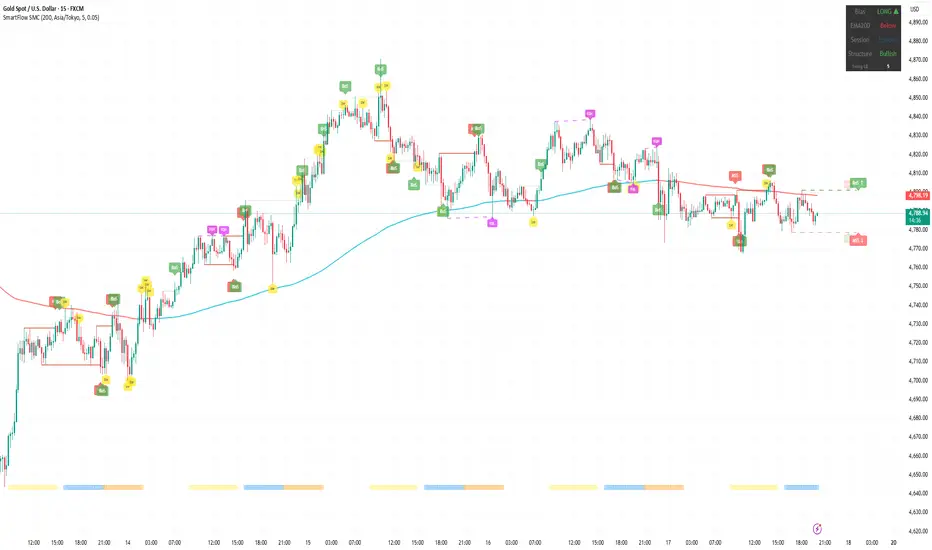
Gold at $4,786 with LONG/Below/Bullish. The conflict signal returns. Structure has flipped back bullish with MSS↑ confirmed and BoS↑ printing, but price remains below EMA200 ($4,798) — $12 short of reclaiming it.
This is the same pattern from Apr 13: bullish structure below EMA200. Last time it resolved with a bullish reclaim. The chart shows the pullback from $4,860 → $4,770 lows → recovery with bullish BoS stacking through $4,780, $4,790, now testing $4,800.
The MSS at $4,800 area marked the structural flip and the BoS↑ label at the right edge shows buyers pushing. EMA200 is the gatekeeper.
KEY LEVELS
Resistance: $4,798 (EMA200 — must reclaim)
Resistance: $4,810-4,820 (previous BoS zone)
Support: $4,780 (recent MSS area)
Below: $4,770 / $4,760
WHAT TO WATCH
Gold’s relationship with EMA200 has been the defining theme of this tracking period. Every time it dips below with bullish structure, it eventually reclaims — so far. The $4,798 level is the test. A clean close above flips the reading to full bullish. A rejection here and loss of $4,780 negates the bullish structure.
Not financial advice. For educational purposes only.