- September 26, 2025
- Posted by: EWGFX
- Category: Technical analysis
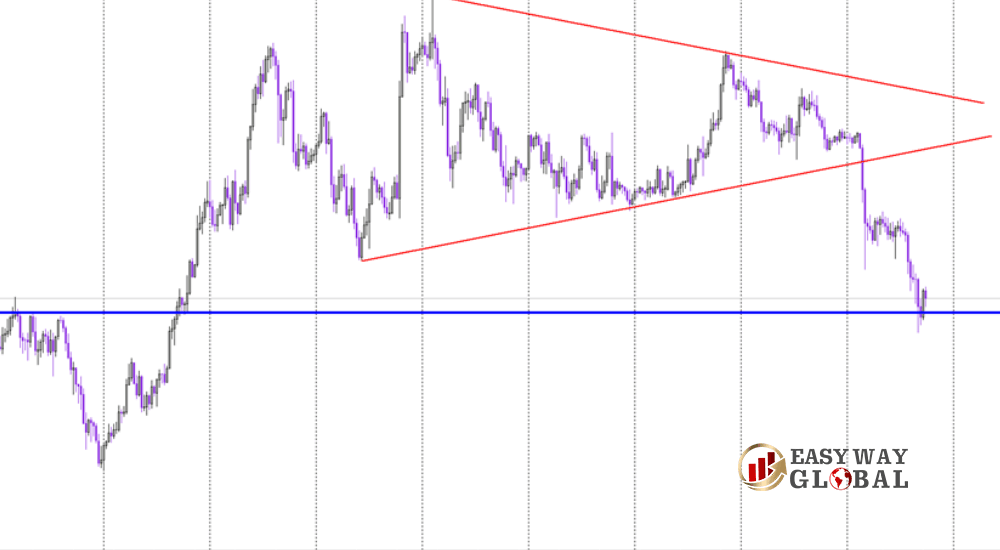
In today’s ETH (Ethereum) H4 analysis, the broader technical picture shows the coin under pressure. Recently, ETH broke down from a symmetrical triangle pattern (outlined in red), sending a strong bearish signal. A short-lived correction followed, but sellers quickly stepped back in, driving prices lower once again.
At the moment, ETH is testing a critical horizontal support highlighted by the blue line — a level that acted as major resistance in late July and has since flipped into support. Price has managed to bounce here, but the recovery looks weak and lacks strong momentum, keeping bullish hopes alive but on fragile ground.
The outlook is clear: as long as ETH remains above the blue support, buyers still have a case for stability. Defending this zone is essential. However, a decisive daily close below it would confirm bearish dominance and open the door to a deeper decline, generating a strong sell setup.