- March 25, 2026
- Posted by: EWGFX
- Category: Technical analysis
Market Structure:
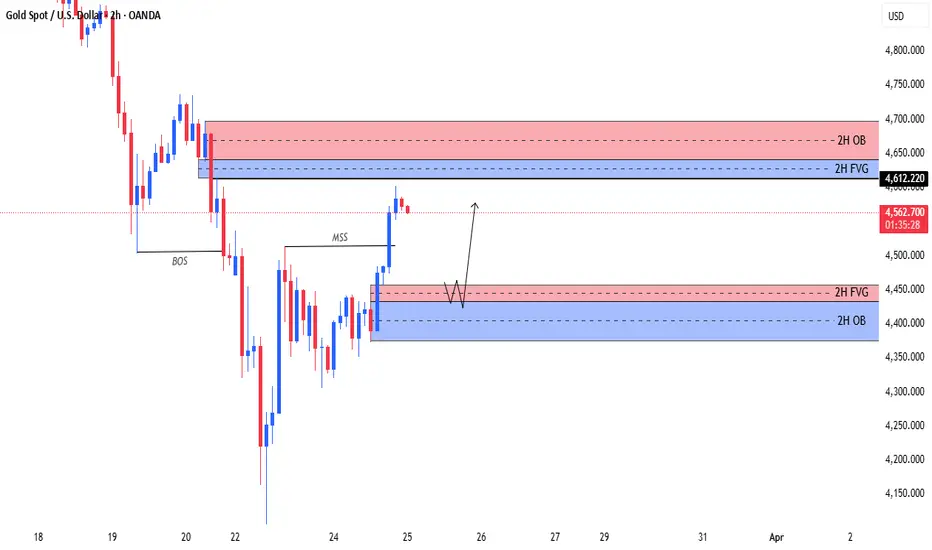
BOS (Break of Structure): There is a clear Break of Structure (BOS) occurring around the 22nd, indicating a potential reversal in trend. The price has formed higher highs, but we need to check for confirmation of a reversal.
MSS (Market Structure Shift): The market shows a Market Structure Shift (MSS) around the 25th, indicating that price may potentially reverse or pull back after testing certain levels.
Key Zones:
2H OB (Order Block): The 2H Order Block (OB) around 4,570 is a major resistance zone. This is a place where sellers may enter the market if price shows signs of rejection.
2H FVG (Fair Value Gap): The 2H Fair Value Gap (FVG) between 4,450 and 4,400 represents an area where price might get attracted before further movement.
Current Price Action:
The price is currently approaching the 2H Order Block at around 4,570. Watch for price rejection signs in this region to confirm a potential short opportunity.
Short Trade Idea:
Entry:
Short Entry Trigger: Wait for a price reaction around the 2H Order Block (4,570). Look for rejection candlestick patterns (e.g., bearish engulfing, pin bar) to confirm a short entry.
Price should show signs of struggling to break through the resistance area.
Stop Loss:
Above Recent High: Place the stop loss just above the recent swing high around 4,590 (allowing room for possible wicks above the resistance zone). This provides protection in case of a false breakout.
Take Profit:
Target 1: The first target should be the 2H Fair Value Gap (FVG) zone near 4,450, which is a reasonable area where price could reverse or consolidate.
Target 2: Further movement could target the blue order block at 4,400, where price may find more support before potentially reversing.
Risk Management & Trade Setup:
Risk-Reward Ratio: The entry at 4,570 and the stop loss just above 4,590 gives a good risk-to-reward ratio (approximately 2:1 or higher, depending on how the market reacts).
Position Size: Ensure the position size aligns with your risk tolerance, generally risking 1-2% of your capital per trade.
Rules Compliance:
Transparency and No Guarantees: Always emphasize that the analysis is based on historical price data and patterns. There’s no guarantee that the price will move in the expected direction.