- April 14, 2026
- Posted by: EWGFX
- Category: Technical analysis
Gold Strategy: Support Confirmed; Market Focus Shifts to PPI Data
Market Overview:
Gold demonstrated strong resilience yesterday; both the psychological threshold of $4,700 and the transitional zone between $4,730 and $4,750 held firm without being breached. The daily chart closed with a candlestick featuring a “long lower shadow,” confirming the presence of active buying interest near the $4,640 level. Although the Asian session opened with a “gap up” today, the gap zone between $4,740 and $4,750 remains a critical support level worthy of close attention.
Technical Analysis (4-Hour Chart):
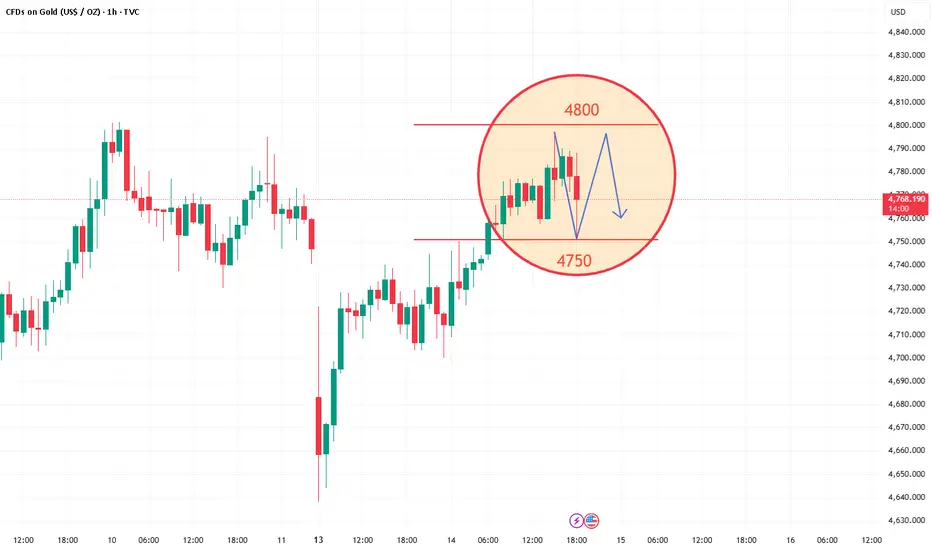
Wave Structure: The current rebound trend, originating from $4,640, likely constitutes a “Wave B” corrective move. Unless gold prices can decisively break through the previous high of $4,850, we may witness the onset of a “Wave C” decline.
Immediate Resistance: The $4,800 threshold serves as the primary test facing the market today.
Macro Outlook: Long-term drivers remain robust. Continued accumulation by central banks—coupled with the diminishing anchoring effect of the U.S. dollar—makes every pullback in gold prices an excellent entry opportunity for long-term holders.
Trade Execution Plan
Primary Strategy: Buy on Dips (Long)
Action Guidance: Seek entry opportunities to buy when gold prices retrace to support levels.
Entry Zone: Focus on $4,740 – $4,750 (Gap Support) or $4,705 – $4,715 (Major Support).
Stop-Loss Placement: Set below $4,690.
Target Prices: $4,780 ➔ $4,800 ➔ $4,850.
Secondary Strategy: Tactical Shorting (Sell)
Action Guidance: Consider shorting only during the release of PPI data, and specifically if gold prices fail to successfully break through the $4,800 threshold.
Entry Zone: $4,795 – $4,805.
Target Price: $4,750 (Gap Fill).