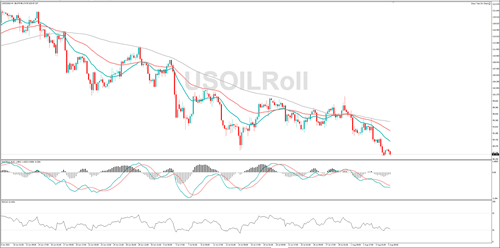
WTI fell to a 5-month low yesterday and RSI is in decline, suggesting the price bias is to the downside. If the bearish move continues, 85.84 or 83.33 could act as support. Resistance might be found at 91.25 or 94.09.
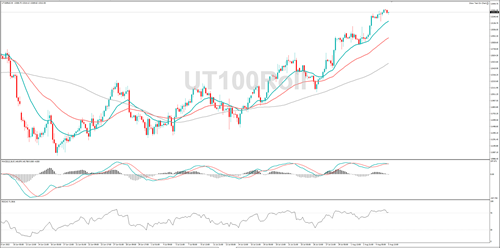
The NASDAQ 100 has retreated from its seven-month high, and momentum has turned negative, suggesting the bears are now dominating. If the broader uptrend continues it might target 13555 or 14000. A move to the downside, could find support at 13165 or 13041.
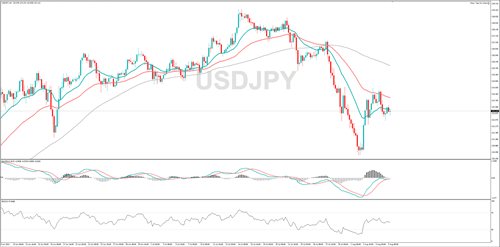
USD/JPY is moving lower once again and momentum has turned negative, implying the sellers have regained control. If the bearish move continues, it could hit 132.95 or 132.20. 134.59 or 135.74 might act as resistance.
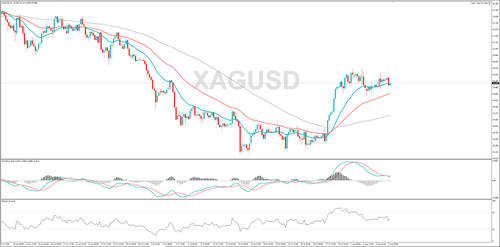
Silver is pushing lower and so is the RSI, and that indicates the price bias is to the downside. 19.76 or 19.27 could act as support. If the wider bullish trend resumes, 20.49 or 20.80 might act as resistance.
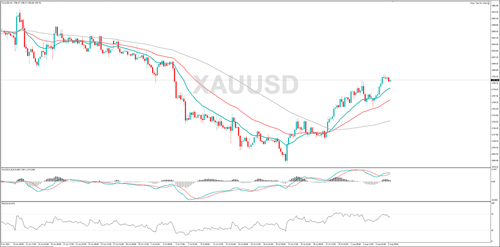
Gold is trending higher, and but positive momentum is fading, implying the bulls are losing a bit of control. If the uptrend continues, it might target 1800 or 1811. A pullback could retest 1753 or 1736.
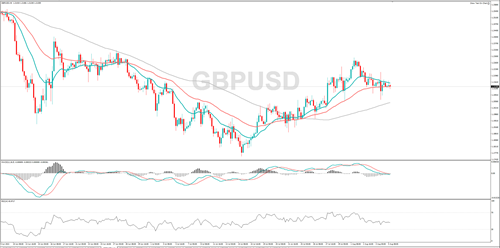
GBP/USD has pulled back from the five-week high set at the start of the week, and RSI is moving lower, suggesting the price bias is to the downside. 1.2065 or 1.2000 could provide support. A break above 1.2214 could bring 1.2292 into play.
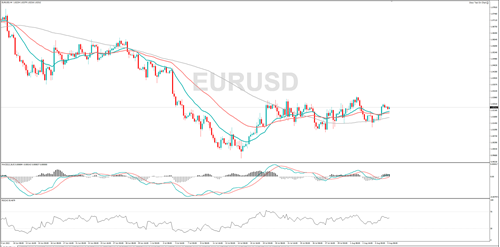
EUR/USD is edging higher and the MACD indicator shows that momentum is positive, implying the buyers are dominant. A rally from here could see it target 1.0293 or 1.0324. A decline might see it find support at 1.0095 or 1.0027.
It’s important to remember that bullish hammers should have long wicks at least twice the length of the candle body. In addition, the candle itself can either be red or green depending on the strength of the reversal.
Often the bullish hammer is confused with a bearish hanging man candle. The misrepresentation is logical because both candles look identical. The difference between these two candles lies in their placement in a trending market. The hanging man has a small body and long wick but is found hanging at the end of an uptrend. Bullish hammers have small bodies and long wicks also but are only seen at the end of a downtrend.
How to spot a Bullish Hammer pattern:
Candle with a short body and long wick (at least 2x the size of the body)
Occurs at the bottom of a downward trend
Confirmation from other indicators as mentioned below
What does it indicate:
Trend reversal to the upside (bullish reversal)
Price rejection at a certain ‘key level’
Value to traders:
Indicates potential price reversals which could lead to entering a long position at the start of an upward swing – capitalize on the full upward movement
Easy to identify
USING A BULLISH HAMMER CANDLESTICK PATTERN IN TRADING
Bullish hammer candlestick in the forex market
Bullish hammer candles can be found on a variety of charts and time frames. Depicted above is an example of the hammer on the AUD/USD daily chart. From 20 April through to 31 May the AUD/USD fell as much as 892 pips. This downtrend was concluded with a bullish hammer candle, and price has subsequently rallied a total of 792 pips through today’s price action.
As the strength of a hammer depends on its placement on the graph, normally traders use this candle in conjuncture with other indications of price support. This includes using tools such as Fibonacci retracements, pivot points and psychological whole numbers. In an ideal scenario, the wick of the hammer will penetrate a support level, but the body will close above support on renewed buying sentiment. With a new buying opportunity presented, traders may then choose to place stops under the created wick below support.
Bullish hammer candlestick in the equity market
The bullish hammer candle is interpreted the same way in all financial markets (indices, forex, commodities and stocks) however, stock analysis requires further data as confirmation. It is important to note that brokers generally show internal volume figures for the other financial markets including forex which is why the volume indicator is not reliable for an overall market volume estimate.
The chart below shows a bullish hammer candle on a Barclays PLC chart. In conjunction with the bullish hammer, there is a subsequent relative increase in volume traded as highlighted. This emphasizes institutional activity for this period due to the large volume – retail traders will not be able to affect such large volumes.
This ‘denial’ by bulls (traders taking long positions) after the recent swing low displays price rejection at that level. This level may be a key level whereby ‘buy’ order are triggered. With the bullish hammer and the volume exhibit this relationship, traders can have some form of validation to place a long trade. As always, the principals of risk management should apply to all trades.

FURTHER READING ON TRADING WITH CANDLESTICK PATTERNS
The bullish hammer candle is one of many bullish price patterns that can assist traders when entering a trade. Other bullish patterns traders should be aware of, include: morning star and the inverse head and shoulders among others.
Day traders, however, incorporate the use of indicators and key levels of support and resistance, alongside candlesticks, to substantiate trades before entering. Other aides you can use to improve your trading include our free trading guides and for those just getting started, take a look at our New to FX guide.
Disclaimer: Information provided in our communications/technical analysis reports are provided for your convenience and information purposes only. No information contained in communications and/or analysis reports should constitute a solicitation for the purpose of purchase and/or sale of any financial instrument, nor should they serve as the basis of any investment decision / recommendation / advice. Easy Way Global Limited. Does not guarantee the accuracy or completeness of any information, analysis, forecast or similar, provided by any employee of Easy Way Global Limited or third party. Although Easy Way Global Limited does its very best to provide the best quality service at all times, Easy Way Global Limited shall not be held liable to any client/partner and/or third person for the accuracy of the information, content, or any other related matter. Expressions of opinion included within reports/communications may be personal to the author and may not necessarily reflect the opinion(s) of Easy Way Global Limited.