- March 17, 2026
- Posted by: EWGFX
- Category: Technical analysis
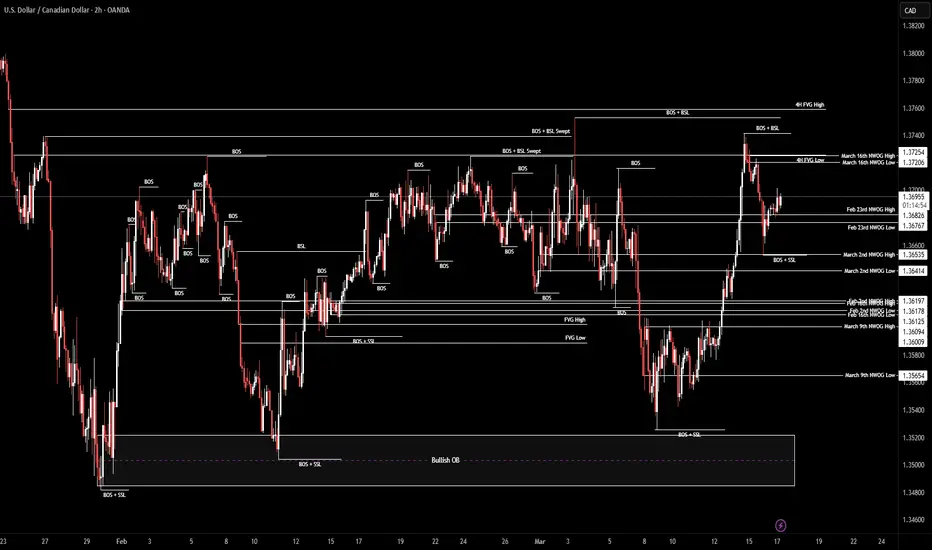
By examining the 2H Chart of USDCAD we can see that with the bullish run, it reached the high of 1.3741, going inside the 4H FVG and going above the C.E., but it failed to hold above and started to drop, going as low as 1.3653, reaching the March 2nd NWOG High and then bounced back up, currently being traded at 1.3695, above the Feb 23rd NWOG.
Now, I expect USDCAD to drop and hit the Feb 23rd NWOG high and then go back to reach the higher targets. It also has a resistance ahead of it at 1.3705 which is very vital for USDCAD to break above it strong, otherwise it’ll drop again.
Now the targets in different scenarios:
If it goes straight up without going back to the Feb 23rd NWOG and breaks above the resistance: 1.3705, 1.3713 and 1.3720.
If it fails to hold above the Feb 23rd NWOG: 1.3685, 1.3675 and 1.3665.
If it bounces back up after hitting the Feb 23rd NWOG: 1.3692, 1.3700, 1.3708 and 1.3716 and 1.3723.