- March 6, 2026
- Posted by: EWGFX
- Category: Technical analysis
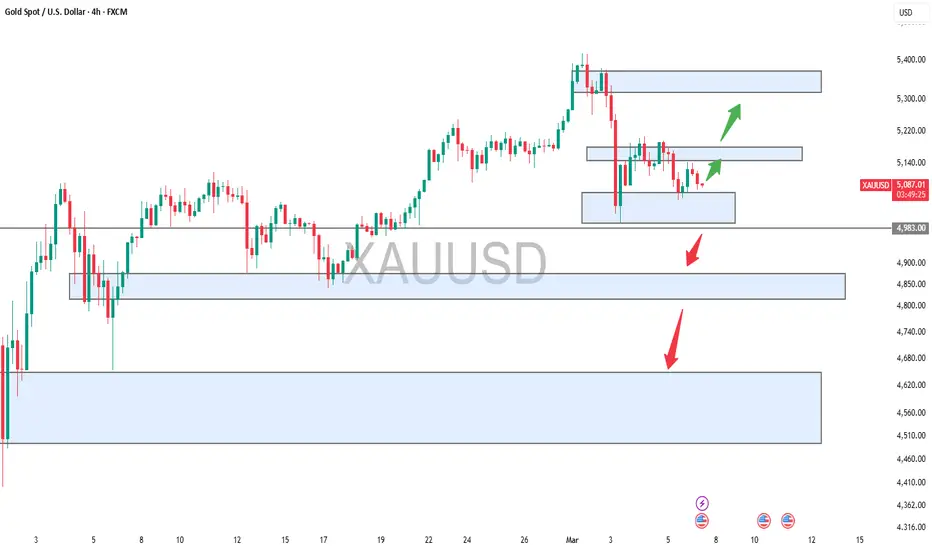
Gold is currently trading inside a corrective phase after a strong impulsive move down from the major supply zone around 5,300 – 5,350. That area clearly shows where institutional selling pressure entered the market, leading to the sharp bearish displacement that followed.
After the drop, price reached a short-term demand zone around 5,030 – 5,060, where buyers reacted and created the current consolidation structure.
At the moment, the market is moving between three important zones visible on the chart.
Current Market Structure
The current structure shows a pullback within a bearish move.
Price created:
A strong impulsive bearish leg Followed by a weak bullish retracement This suggests the market may still be seeking liquidity before the next move.
Bullish Scenario If buyers continue defending the 5,030 – 5,060 demand zone, price could push higher toward the 5,140 – 5,170 resistance zone.
A break and close above this resistance would open the path for a continuation toward the higher supply zone near 5,300 – 5,350.
That zone remains the primary liquidity target if bullish momentum increases.
Bearish Scenario If the market fails to maintain the current demand support, sellers could regain control.
A break below 5,030 would likely push price toward the major demand zone around 4,850 – 4,900, which previously acted as a strong accumulation area.
If bearish momentum continues beyond that level, the next macro liquidity pool sits around 4,600 – 4,650.
Key Levels to Watch
Resistance
• 5,140 – 5,170
• 5,300 – 5,350
Support
• 5,030 – 5,060
• 4,850 – 4,900
• 4,600 – 4,650